
In June 2020, the Federal Reserve issued stringent payout restrictions for the largest banks in the United States as part of its policy response to the COVID-19 crisis. Similar curbs on share buybacks and dividend payments were adopted in other jurisdictions, including in the eurozone, the U.K., and Canada. Payout restrictions were aimed at enhancing banks’ resiliency amid heightened economic uncertainty and concerns about the risk of large losses. But besides being a tool to build capital buffers and preserve bank equity, payout restrictions may also prevent risk-shifting. This post, which is based on our recent research paper, attempts to answer whether and how payout restrictions reduce bank risk using the U.S. experience during the pandemic as a case study.
How Payout Restrictions Are Thought to Affect Bank Risk
When a firm is sufficiently levered, shareholders have incentives to take on excessive risk due to limited liability (Jensen and Meckling, 1976). This implies a shift of risk from shareholders to debtholders, who hold a claim on the firm’s assets after capital distributions are made. This was exhibited during the global financial crisis, with several banks maintaining or even increasing their shareholder payouts in 2007 and the first half of 2008 (Acharya et al., 2017). Payout restrictions, by preserving bank equity, mitigate shareholders’ incentives to shift risk. Risky investments that would be undertaken in the absence of payout restrictions may become less appealing when a sufficient portion of the downside risk is transferred from debtholders to shareholders.
Payout Restrictions Imposed in 2020 Affected Payout Behavior
On June 25, 2020, the Federal Reserve released a statement announcing that share buybacks would be banned starting in 2020:Q3 and dividends would be capped (at either the value of a firm’s 2020:Q2 dividend or its average earnings over the past four quarters—whichever was lower) for large U.S. banks subject to the Comprehensive Capital Analysis and Review (henceforth CCAR banks). The Federal Reserve specified that these restrictions would be re-evaluated on a quarterly basis in light of the economic environment, without a pre-determined expiration date. On December 18, 2020, the Federal Reserve announced that it would remove the ban on share repurchases, while maintaining much less stringent restrictions on total payouts (the sum of quarterly dividends and share buybacks could not exceed average quarterly earnings from the past four quarters). Since the bulk of bank payouts occurred via share buybacks prior to the pandemic, this announcement implied a substantial relaxation of payout restrictions. On March 25, 2021, the Federal Reserve announced that the remaining restrictions would be lifted as of June 2021.
A natural question to ask is whether these restrictions affected payout behavior among CCAR banks. The chart below shows that the aggregate net payout ratio of domestic CCAR banks fell by half in 2020, when payout restrictions were in place, after a protracted upward trend. During the same period, domestic CCAR banks experienced a 5.8% increase in their aggregate Tier 1 capital. Upon relaxation of the restrictions, several banks restarted their share buyback programs, thereby raising the aggregate net payout ratio in 2021:Q1. Overall, this evidence suggests that the payout restrictions imposed in 2020 did indeed affect payout behavior.
Aggregate Net Payout Ratio of Domestic CCAR Banks over Time
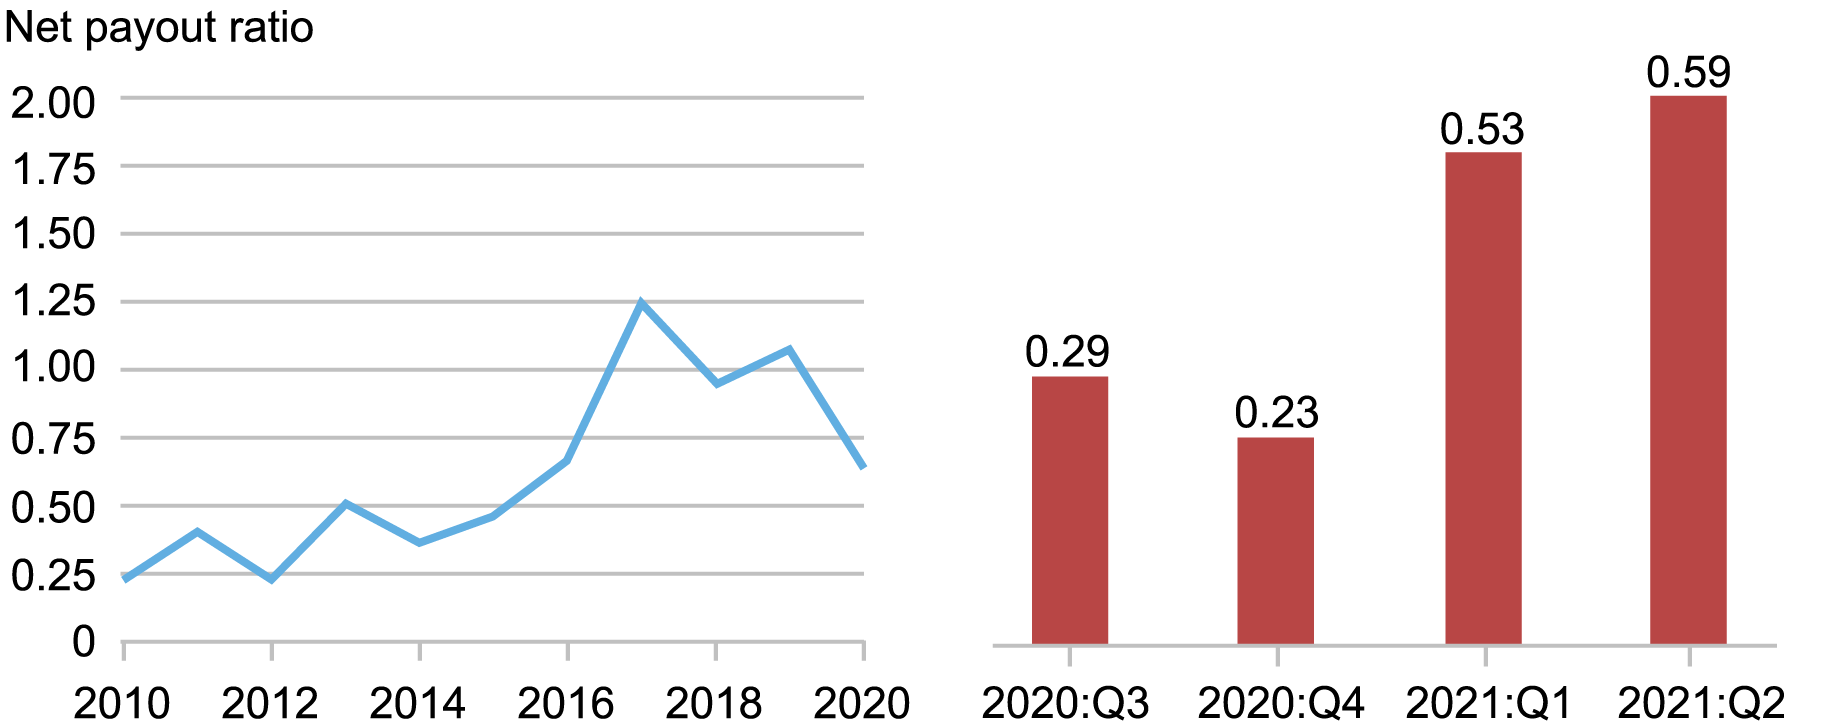
Source: Authors’ calculations, based on data from Compustat and FR Y-9C filings.
Notes: The left-hand panel reports the time series of the yearly aggregate net payout ratio of domestic CCAR banks over 2010-20. Net payout ratio is defined as dividends plus share buybacks minus issuances divided by net income. The right-hand panel reports the quarterly aggregate net payout ratio of domestic CCAR banks from 2020:Q3 to 2021:Q2.
Payout Restrictions Imply a Risk Transfer from Debtholders to Shareholders
Next, we investigate the impact of payout restrictions on bank risk. We start by looking at the reaction of banks’ stock prices to the introduction and subsequent relaxation of restrictions. The following chart tracks equity prices for i) domestic CCAR banks and ii) other firms excluding CCAR banks around the June 2020 announcement and the December 2020 announcement. Stock price quotes are aggregated minute-by-minute and normalized to 1 at 16:00 ET, shortly before the 16:30 ET announcement times. CCAR banks lose more than 2 percent in equity value relative to other financial and non-financial firms within minutes of the restrictions’ announcement. Conversely, equity prices jump by 4 percent relative to the same control group within minutes of the announcement that the restrictions would be relaxed. While focusing on a narrow time window around the announcements enables us to identify the impact of payout restrictions on equity values neatly by avoiding potential confounding factors, these results are also observed over longer time horizons (from two weeks to more than a month).
Stock Prices of Domestic CCAR Banks and Other Financial Firms around Payout Restriction Announcements
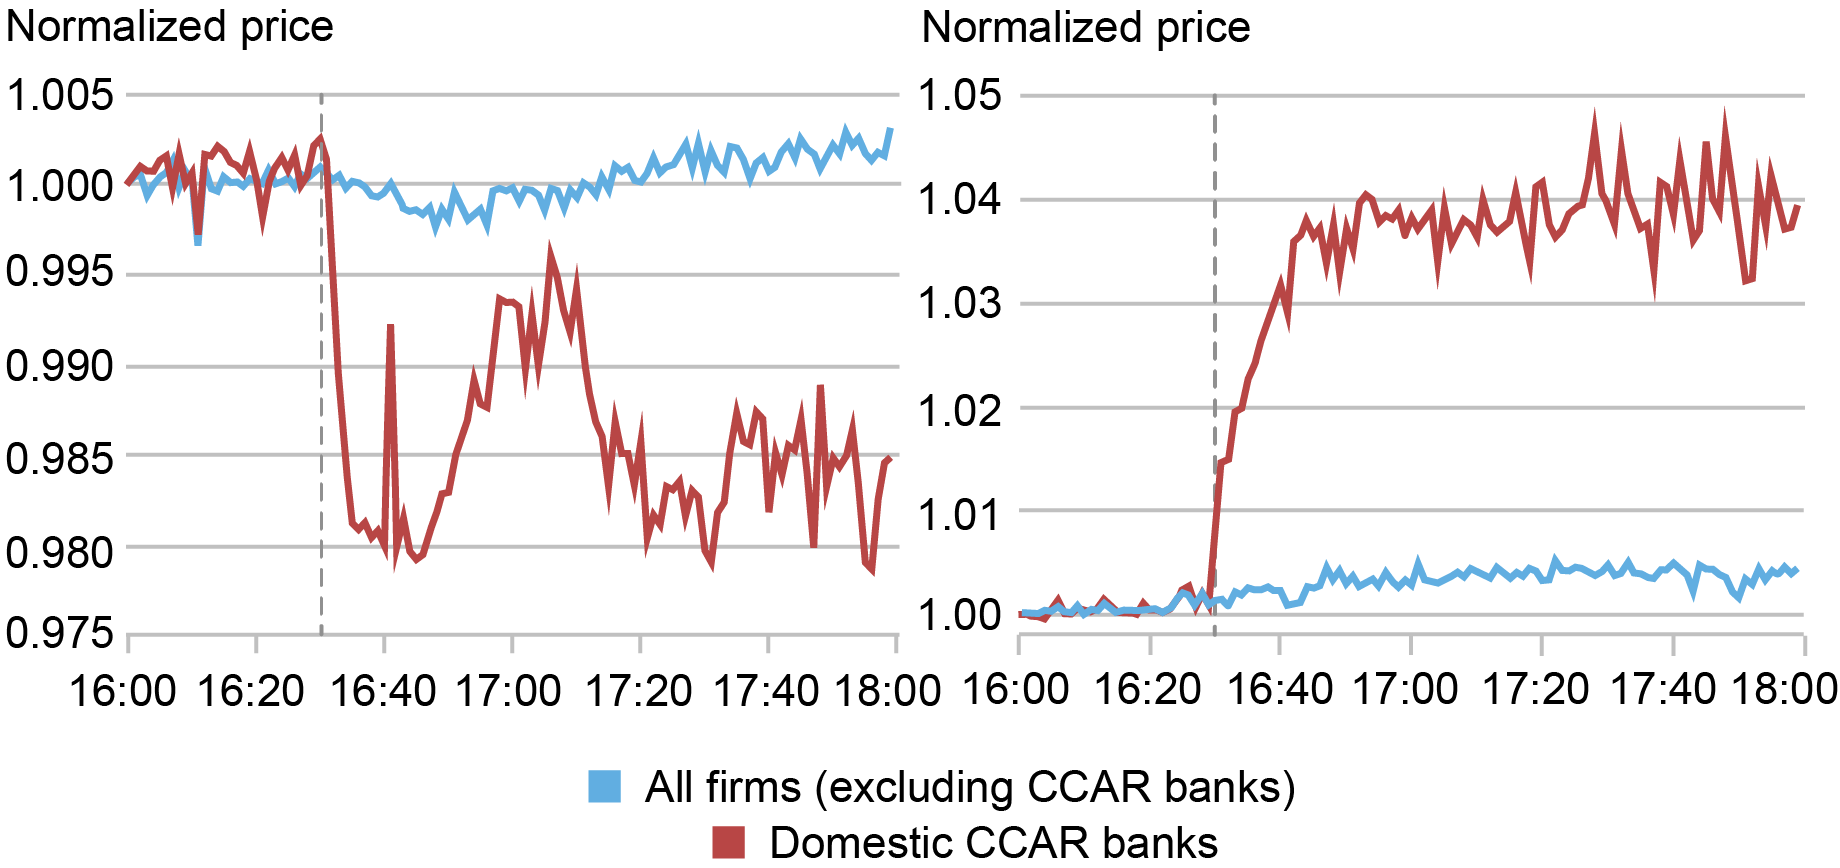
Source: Authors’ calculations, based on data from the NYSE Trade and Quote (TAQ) database.
Notes: The chart reports the time series of the average stock price of i) domestic CCAR banks and ii) other firms excluding CCAR banks around the announcement of the introduction of payout restrictions on June 25, 2020 (left-hand panel) and around the announcement of the relaxation of payout restrictions on December 18, 2020 (right-hand panel). The vertical dashed lines indicate the 16:30 ET announcement times. Data are aggregated minute-by-minute and normalized to 1 at 16.00 ET.
We now turn to the impact of payout restrictions on banks’ debt values. To this end, we compare the daily CDS spreads of domestic CCAR banks to those of other financial firms excluding CCAR banks within five trading days around the two policy announcements. CDS spreads fall by 3 basis points for CCAR banks relative to other financial firms when payout restrictions are imposed in June 2020, and, conversely, rise by 1 basis point relative to the control group after they are relaxed in December 2020. The imposition of payout restrictions thus implies lower default risk and higher debt values, which both revert when the restrictions are lifted. Similar results are obtained for corporate bond yields rather than CDS spreads.
There are two main takeaways from these findings. First, both announcements were at least partially unanticipated and hence not fully priced in. Second, and more importantly, payout restrictions have a negative effect on equity values and a positive impact on debt values. This is consistent with a shift of risk from debtholders to equityholders when restrictions are imposed, and vice versa when restrictions are relaxed. Limitations on payouts reduce the stream of cashflows to shareholders, thereby reducing equity values. At the same time, they shore up capital and make default less likely. The persistence of these effects in the medium to long term suggests that the mechanical decline in bank risk due to improved capital buffers is not counteracted by an increase in risk-taking on the asset-side of banks’ balance sheets.
CDS Spreads of Domestic CCAR Banks and Other Financial Firms around Payout Restriction Announcements
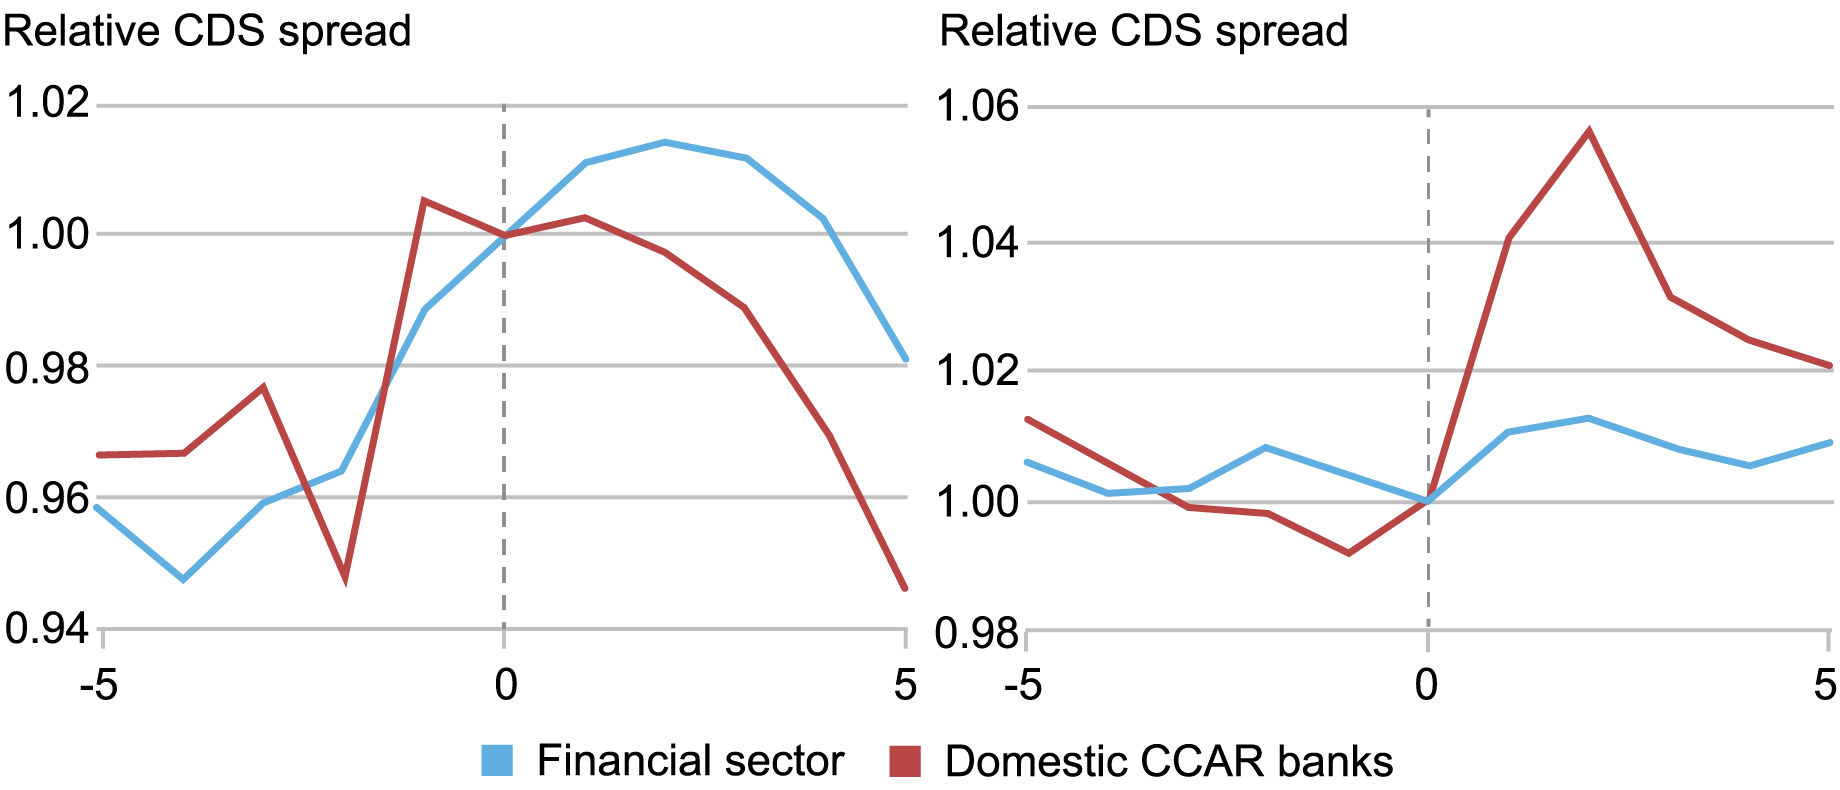
Source: Authors’ calculations, based on data from Markit.
Notes: The chart reports the time series of the average daily CDS spread of i) domestic CCAR banks and ii) other financial firms excluding CCAR banks within five days around the announcement of the introduction of payout restrictions on June 25, 2020 (left-hand panel) and around the announcement of the relaxation of payout restrictions on December 18, 2020 (right-hand panel). Values are normalized to 1 on the date of the announcement.
Payout Restrictions Reduce Banks’ Risk-Taking in Lending
As a last step, we explore how payout restrictions affect banks’ risk-taking decisions. As discussed above, the introduction of payout restrictions implies a shift of risk from debtholders to shareholders and may thus induce shareholders to reduce risky investments. Conversely, when payout restrictions are removed, shareholders can, on the one hand, pay out more and, on the other hand, exploit the call-option feature of risky projects.
We test whether the imposition of payout restrictions mitigates risk-taking by exploiting granular information on corporate lending by domestic CCAR banks from FR Y-14Q filings. We distinguish domestic CCAR banks based on their ex-ante reliance on share buybacks relative to dividends for shareholder payouts. While share buybacks were fully banned in 2020, dividends were effectively capped at their current levels, implying that institutions with a historically larger buyback-to-payout ratio were more constrained by the restrictions. We test whether banks that were ex ante more reliant on share-buybacks reduce lending to risky borrowers relative to more dividend-reliant banks while payout restrictions were in place, and whether this trend reverts once the restrictions are lifted.
In the chart below, the left-hand panel shows that there is no overall differential impact of payout restrictions on total bank lending when comparing more restricted banks to less restricted banks, as captured by the pre-pandemic buyback-to-payout ratio. However, the restrictions seem to have affected the allocation of credit to borrowers with different risk profiles in the two groups of banks. Consistent with our hypothesis, the right-hand panel reveals that lending to risky firms at buyback-reliant banks grew less than lending to risky firms at less buyback-reliant banks while the restrictions were in place. This pattern reverted once the restrictions were removed in December 2020.
Overall, our findings indicate that payout restrictions imposed on banks are effective in expanding capital buffers and mitigating risk-taking incentives, thereby reducing banks’ risk in times of crisis.
New Loans Extended by Domestic CCAR Banks
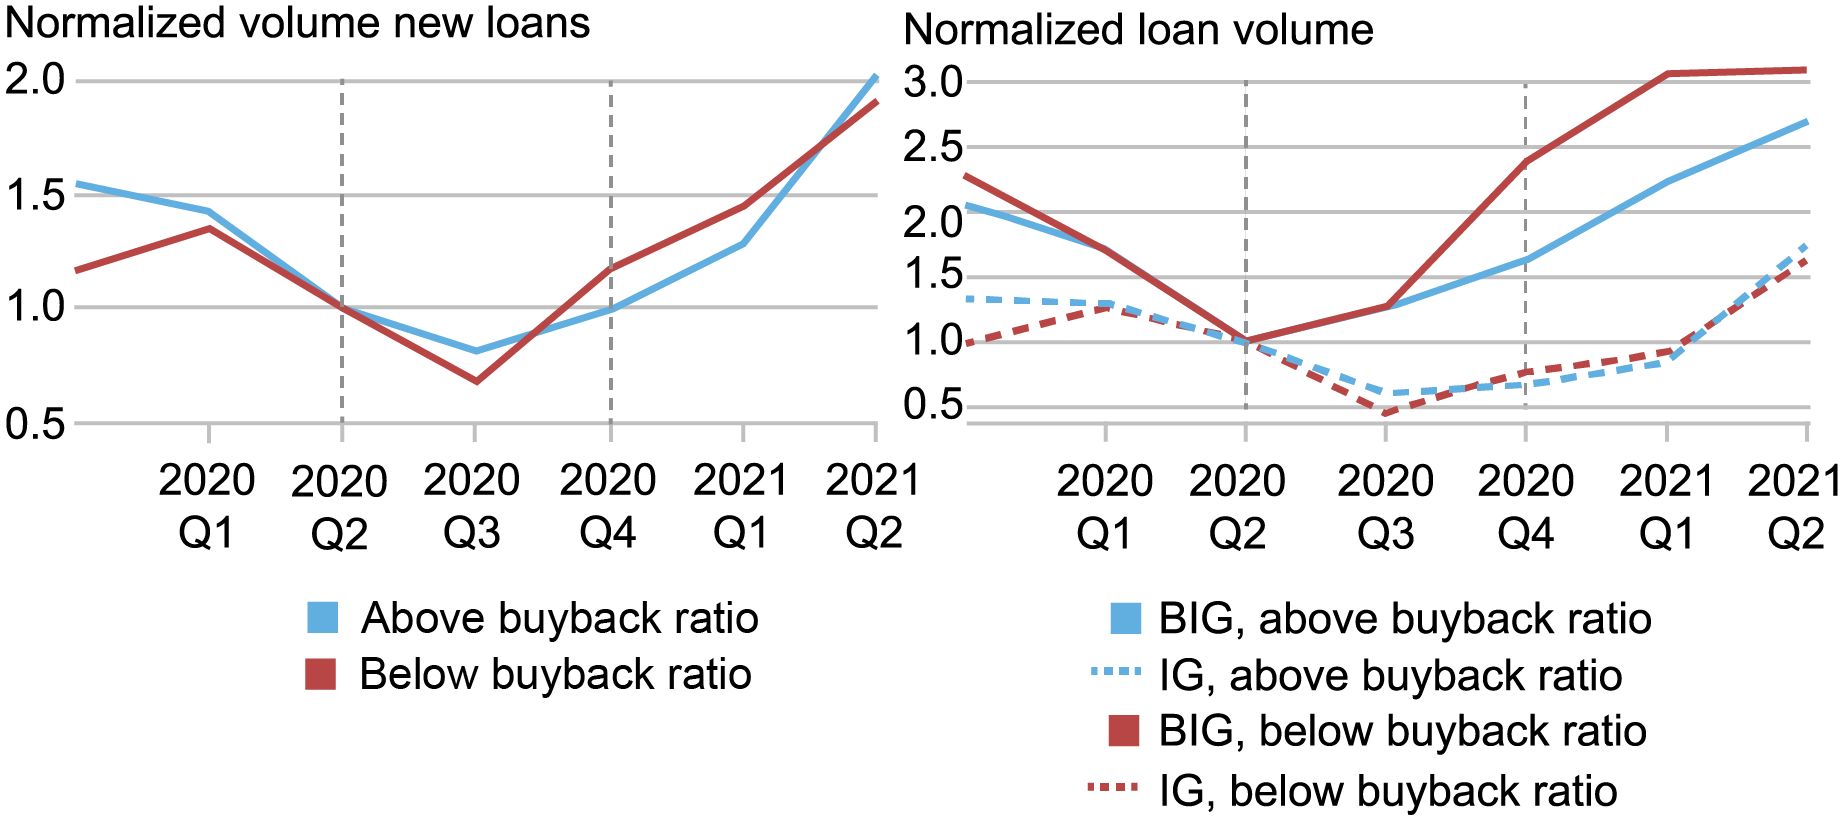
Source: Authors’ calculations, based on data from FR Y-14Q Schedule H1.
Notes: The left-hand panel reports the aggregate volume of new loans extended by domestic CCAR banks with an average buyback-to-payout ratio in 2017-2019 above and below the median. The right-hand panel reports time series of the aggregate volume of new loans ii) investment grade and ii) below investment grade extended by banks with an average buyback-to-payout ratio in 2017-2019, respectively, above and below the median. Values are normalized to 1 in 2020:Q2. Investment grade loans are identified as those extended to firms with a probability of default below 5 percent as estimated by the bank; below investment grade loans are identified as those extended to firms with a probability of default above 5 percent as estimated by the bank.

Fulvia Fringuellotti is a financial research economist in Non-Bank Financial Institution Studies in the Federal Reserve Bank of New York’s Research and Statistics Group.
Thomas Kroen is an economist in the Research Department at the International Monetary Fund.
How to cite this post:
Fulvia Fringuellotti and Thomas Kroen, “Do Payout Restrictions Reduce Bank Risk?,” Federal Reserve Bank of New York Liberty Street Economics, January 8, 2025, https://libertystreeteconomics.newyorkfed.org/2025/01/do-payout-restrictions-reduce-bank-risk/.
Disclaimer
The views expressed in this post are those of the author(s) and do not necessarily reflect the position of the Federal Reserve Bank of New York or the Federal Reserve System. Likewise, those views do not represent the position of the International Monetary Fund (IMF), the IMF’s Executive Board, or the IMF’s management. Any errors or omissions are the responsibility of the author(s).


