

The conflict in the Middle East has precipitated a global supply shock—the third in six years following the pandemic in 2020 and Russia’s invasion of Ukraine in 2022. The current shock raises the specter of spillovers to the U.S. through both prices and physical shortages of goods. A critical conduit for spillovers through these channels is via Asian supply chains, especially from middle- to lower-middle income countries in southeast Asia, which are key suppliers for goods needed for the AI infrastructure build-out in the U.S. These countries are also heavily reliant on Middle East energy imports. This post examines key factors related to these Asian supply chain vulnerabilities.
How Large Are Supply Strains Thus Far?
The Middle East conflict has caused the virtual closure of the Strait of Hormuz (SOH). While the closure has had major implications for global energy markets—prior to the onset of hostilities, shipments through the SOH account for approximately one-fifth of global crude oil and a quarter of liquified natural gas (LNG) exports—the effects on global supply chains are much broader. This is illustrated in the chart below of the New York Fed’s Global Supply Chain Pressure Index (GSCPI). Over the two months since the conflict began, the index rose by 1.3 points, to 1.8 standard deviations above its average value.
The GSCPI extracts the supply signal from survey data on manufacturing industry delivery times, order backlogs, and inventory stocks as well as shipping costs for ocean and airfreight. The index had been gradually climbing even before the conflict began, likely in part reflecting strains from the boom in artificial intelligence investment. Within the GSCPI model, the increases in the index have been driven predominantly by lengthening delivery times and growing order backlogs.
Global Supply Chain Pressure Index

The increase in the GSCPI has exceeded the level of the Fukushima nuclear crisis in 2011 but remains well below the peaks reached during the COVID-19 pandemic. Nonetheless, the abruptness of the increase has been among the largest experienced outside of the pandemic and the index itself may not be capturing the nuances of the geographic and industry-specific supply pressures that are currently being experienced, and are the focus of this post. Moreover, research suggests that supply-inflation dynamics can be nonlinear at levels of the GSCPI below pandemic peaks.
As implied by the large increase in the GSCPI, recent geopolitical events have much broader supply implications than the oil market alone. Indeed, the petrochemical industry plays a key role in a wide range of goods and services. The world’s food supply, for example, relies on fertilizers that are a byproduct of LNG production in the Middle East. The petrochemical industry produces fuels for aircraft, ocean shipping, and cooking as well as plastics, rubber, fibers, and helium—all critical inputs for both low- and high-tech manufacturing, including investment in artificial intelligence.
These broader strains are readily apparent in prices for industrial inputs. The first chart below shows selected petrochemical-related prices—fertilizer, feedstocks and products for plastics (ethylene and polyethylene), and naphtha (a hydrocarbon product with a wide range of fuel and industrial uses). These prices have all skyrocketed, with recent attention focused on the “plastic shock.” The second chart shows that even before the conflict, surging demand for AI-related investment was already straining the high-tech supply chain: computer memory prices had skyrocketed, while U.S. producer prices for computer-related goods were on a steepening upward trend. Semiconductor manufacturing could face additional strains if helium falls into short supply as about a third of the world’s supply passes through the SOH.
Middle East Conflict Is Driving Petrochemical Higher
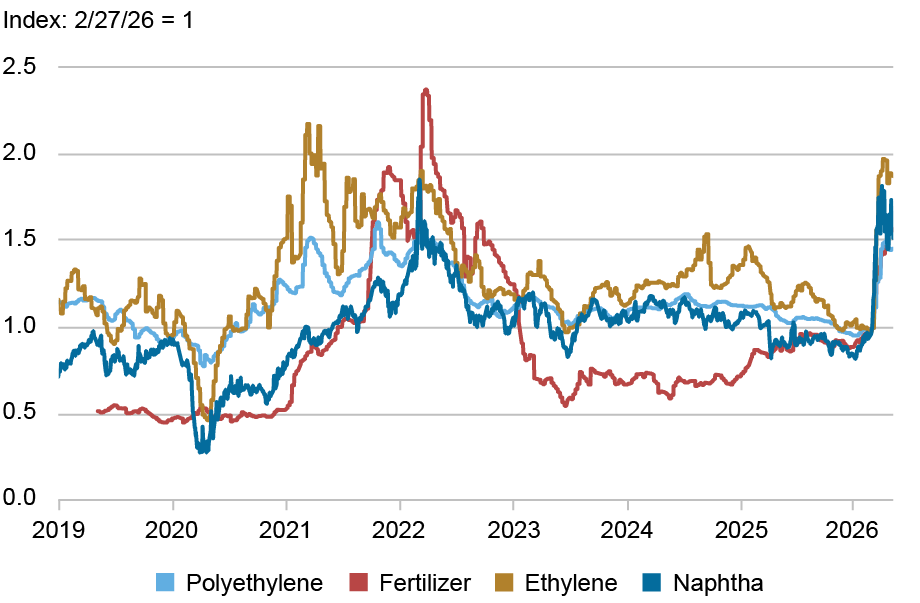
Note: Prices shown are averages of spot or near-future indices for Asia, North America, and Europe, where available.
High Tech Prices Are Surging on AI Investment Boom

Notes: PPI shows PPI for final demand of electronic computers and computer equipment. PPI data are monthly and memory prices are daily.
Asia Supply Chain Vulnerabilities
Although the supply shock so far has manifested mostly in prices, there is a risk of physical shortages similar to those during the pandemic. Manufacturing supply chains in Asia would be a particularly salient vector for disruptions as the region is highly reliant on Middle Eastern suppliers and plays a central role in high-tech and AI investment.
As the table below shows, Asia is highly dependent on petroleum products from the Middle East, and these supply disruptions threaten the region’s manufacturing supply chains through several channels. In countries reliant on imported LNG for a meaningful share of power generation (for example, Thailand), electricity shortages in a severe shortfall scenario could reduce factory operating hours. Reduced supply of diesel and jet fuel are already increasing the cost of road, rail, water, and air transport—both for inputs heading to factories and final goods headed to ports.
Asia Faces Significant Energy Exposure to the Middle East
| | Share of Imports From Middle East (Percent) | Share of Imports From Middle East (Percent) | ||||
| Imported Energy Dependence* | Crude Oil | Liquified Natural Gas | ||||
| ASEAN | ||||||
| Thailand | 58 | 60 | 27 | |||
| Philippines | 54 | 97 | 8 | |||
| Vietnam | 34 | 72 | 26 | ` | ||
| Malaysia | 0 | 72 | 0 | |||
| Indonesia | 0 | 18 | 0 | |||
| Northeast (high-income) Asia | ||||||
| Taiwan | 94 | 69 | 38 | |||
| Japan | 87 | 94 | 10 | |||
| South Korea | 85 | 66 | 19 | |||
| China | 24 | 41 | 30 |
* Net energy imports as a percent of total energy use.
The Strait of Hormuz closure has also curtailed the supplies and raised the price of the petrochemical naphtha, a key feedstock for polymers used in a wide spectrum of manufacturing goods including plastics, rubber, fibers, and industrial gases. These are critical inputs for Asian manufacturers from low value-added footwear to auto parts to integrated circuits and other high value-added electronics.
Petroleum stockpiles vary significantly across countries in Asia, meaning differences in the timing and severity of some of the SOH disruption’s effects on manufacturing supply chains. According to U.S. Energy Information Administration data, China is estimated to hold the largest petroleum reserves in the world of 1.4 billion barrels of crude, enough to cover at least nine months of lost net oil imports from the Persian Gulf. High income economies Japan and South Korea are reported by the International Energy Agency (IEA) to have roughly six months of total net import coverage. Based on public comments from government officials, Taiwan appears to hold the equivalent of about five months of crude oil imports (although Taiwan is more vulnerable to LNG shortages due to minimal stockpiles).
By contrast, government statements and press reports indicate ASEAN countries (Association of Southeast Asian Nations, comprising 11 member states including Indonesia, Malaysia, the Philippines, Thailand, and Vietnam) hold relatively lower petroleum stockpiles, ranging from the equivalent of around three months of middle eastern crude oil imports in Thailand to around a month in Vietnam. The government of the Philippines recently reported the country holds petroleum inventories equal to roughly three months of imports from the Middle East.
How Exposed Is the U.S. to Supply Disruptions in Asia?
The high inventories in China and high-income Asian economies provide some runway before shortages reach the U.S.—but there is nonetheless risk that spillovers will materialize more quickly through the “weakest links” in ASEAN. The reason is straightforward: ASEAN has become tightly integrated into the Asia manufacturing supply chain. Since the beginning of 2024, U.S. reported imports from ASEAN have increased by about 46 percent, including a nearly 30 percent growth rate last year. Imports from the high-income countries grew by a similar amount, while those from China have plunged. Total U.S. imports from these three groups of countries have grown strongly. Based on analysis in a previous post, ASEAN has become a key supplier of goods like networking equipment (for example, switching and routing apparatuses) that are crucial inputs for the build-out of AI-related data centers in the U.S.
The chart below shows that supply pressures are rapidly building in Asia outside of China. This chart shows purchasing manager survey indices of supplier delivery times for China, high-income northeast Asia (Japan, Korea, and Taiwan) and the three largest exporters to the U.S. from ASEAN (Vietnam, Malaysia, and Thailand), with the two regions weighted by U.S. import shares. An increase in these indices signifies a lengthening in delivery times, and the effects of changes in demand have been removed from the delivery times by regressing new orders on the latter. The weighted average of both regions has already exceeded two standard deviations above historical averages and are among the highest recorded outside of the pandemic. Only China has been relatively unscathed so far, reflecting its relatively greater resilience.
Asia ex-China Supply Chains are Strained

Notes: Individual country supplier delivery time indices are adjusted for demand influence, set to mean zero and unit standard deviation, and weighted by rolling three year U.S. import. High income NE Asia is Japan, Korea, and Taiwan. ASEAN-3 is Malaysia, Thailand, and Vietnam.
The charts below give some perspective on the role that the economies in ASEAN play relative to the much larger economies of northeast Asia. The top chart shows exports to the U.S. of a range of goods—mostly intermediate inputs to industrial processes—that are directly impacted by the SOH closure. ASEAN’s exports of these goods are comparable in size to those from northeast Asia and substantially larger than from China. The bottom chart gives a sense of the importance of the ASEAN region in supplying goods needed for AI and high-tech investment. The increase in ASEAN’s importance for the U.S. has been dramatic and has coincided with a sharp decline in China’s share; ASEAN even exceeded Northeast Asia’s last year.
Asia’s Integral Trade Linkages to the U.S., Particularly for AI Investment
Exports to the U.S. of Goods Vulnerable to Supply Shock

Note: Exports from partner reporter to the U.S. of approximately 60 goods at the HS 6 digit level believed to be particularly vulnerable to supply disruptions in the Strait of Hormuz.
Exports to U.S. of Goods Critical for AI Investment

Note: Exports from partner reporter to the U.S. of approximately 36 goods at the HS 4 digit level that play key roles in AI and data center investment.
Watchpoints Abound
Because U.S. imports of both consumer electronics and AI-infrastructure components have shifted substantially into ASEAN, energy and petrochemical price shocks from the Strait of Hormuz disruption could pass through via higher input and transport costs and, in severe cases, physical shortages. For this reason, ASEAN energy vulnerabilities and specific product flows (laptops, memory, networking equipment and related components) bear close monitoring for anticipating potential near-term U.S. price and supply chain risks.

Hunter L. Clark is an economic policy advisor in the Federal Reserve Bank of New York’s Research and Statistics Group.

Jeffrey B. Dawson is an economic policy advisor in the Federal Reserve Bank of New York’s Research and Statistics Group.

Shad Turney is an international policy and strategy analysis principal in the Federal Reserve Bank of New York’s Markets Group.
How to cite this post:
Hunter L. Clark, Jeffrey B. Dawson, and Shad Turney, “Will Mounting Supply Chain Strains Hamstring the AI Investment Boom?,” Federal Reserve Bank of New York Liberty Street Economics, May 11, 2026, https://doi.org/10.59576/lse.20260511
BibTeX: View |
Disclaimer
The views expressed in this post are those of the author(s) and do not necessarily reflect the position of the Federal Reserve Bank of New York or the Federal Reserve System. Any errors or omissions are the responsibility of the author(s).