
Data releases for inflation have been scarce over the past four months due to the government shutdown. As a result, until January 22 no personal consumer expenditures (PCE) data were available beyond September and the consumer price index (CPI) had many missing entries for the one-month changes for October and November. In this post, we use an extended version of the New York Fed’s Multivariate Core Trend (MCT) inflation model to examine changes in underlying inflation over this period. The MCT model is well-suited to do so because it decomposes sectoral inflation rates into a trend (“persistent”) and a transitory component. In contrast to core (ex-food and energy) inflation, its aim is to remove all transitory factors, thus identifying the underlying trend. In addition, since the model can handle missing data—like for October—it can produce values for trend inflation for months where little or no data were released. Our findings suggest caution: while the fragmented data from November initially signaled a deceleration in price pressures, the integration of December data indicates that these reductions were largely transitory. Once the full data set is used, the aggregate trend for December stands at 2.83 percent, an increase from 2.55 percent in September.
Measuring Missing Inflation Data
We start by measuring month-on-month inflation rates for the last half of 2025. We are mainly interested in the rates for October, November, and December, as little to no data came out over this period.
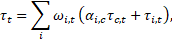
The observation equation of the MCT model links annualized month-on-month sector-specific inflation rates to common and sector-specific trend and transitory components:

where τ(c,t) and τ(i,t) are the common and sector-specific trends that follow a random walk, and ε(c,t) and ε(i,t) are transitory components that are modeled as moving average processes. The model takes both sectoral CPI and PCE rates as input. The equation above is for sectoral PCE inflation. CPI inflation sectors are modeled similarly, but the same trends and idiosyncratic components as for PCE are included, up to a constant of proportionality that is estimated along with the other model parameters. Using the trend components, we can compute the aggregate trend:
where the weight ω(i,t) is the expenditure share of sector i. As we are primarily interested in the trend underlying core inflation, the weights for the sectors food, gasoline, and utilities are set to zero. In addition, we compute trend estimates for core goods, nonhousing core services, and housing using a similar aggregation scheme as for the aggregate trend but tailored to the specific categories.
We estimate the model five times based on the increases in data availability described in the following table. The 10/24/25 information set establishes a benchmark by using only the inflation data available during the shutdown. This is used to produce a nowcast for realized inflation in all components for September and corresponding forecasts for October-December. Next, we update the information set and our estimates every time a new CPI or PCE data set is released.
The Government Shutdown Created Important Gaps in Inflation Data
| Release Date | Latest CPI | Latest PCE |
|---|---|---|
| 10/24/2025 | September | August |
| 12/5/2025 | September | September |
| 12/18/2025 | November | September |
| 1/13/2026 | December | September |
| 1/22/2026 | December | November |
Notes: Each line shows the date at which the information set was increased and to which month the CPI or PCE release corresponded. We note that there was an additional PCE release on 12/23/25 when the September PCE was revised. As this revision did not significantly change the results relative to 12/18/25, we do not include it in the analysis. The 01/22/26 PCE release included data for November as well as October. However, the data for October were based on interpolating between September and November, therefore we do not include it in the MCT model.
Incorporating the November CPI and PCE releases requires additional care. Specifically, as there was no CPI released for October, and only an estimate for PCE in October, we cannot compute the month-on-month inflation rates for October and November (see the technical note in the January 22 PCE release); only the bimonthly inflation rate can be directly computed from the price indexes for September and November. To ensure that the components are correctly measured, we adjust the observation equation above for this period. Specifically, we adjust the observation equation for the bimonthly inflation measurement in November as follows:

where the unobserved month-on-month inflation rates for October and November, November, πi,t and πi,t-1, respectively, are modeled as above. With this modified observation equation, we can back out estimates for the trend and transitory components for October and November just as in the original model. Moreover, we can also back out estimates (that is, nowcasts) for the unobserved monthly PCE inflation rates πi,t and πi,t-1 for October and November. Together with a forecast for PCE inflation in December, this helps us answer the question of whether inflation is persistent or temporary.
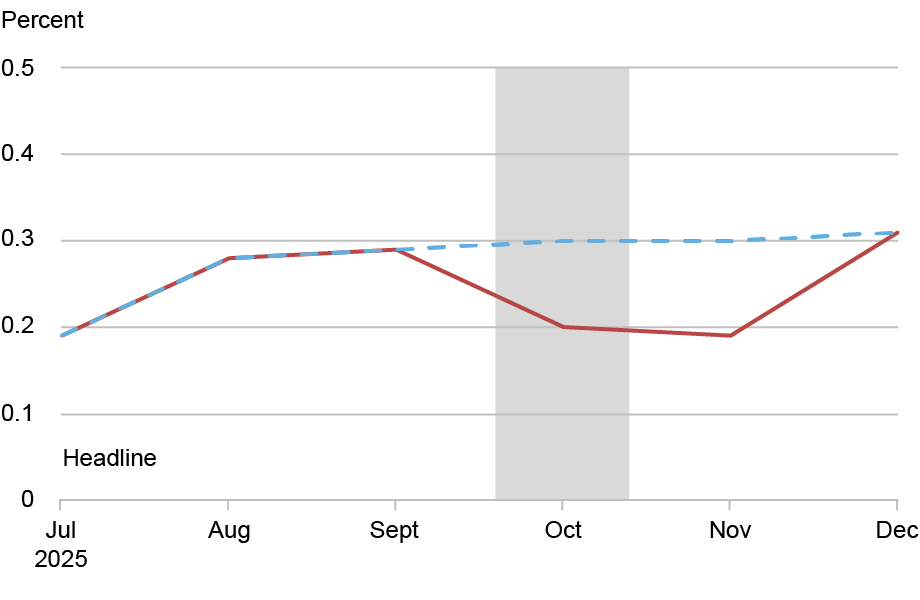
The nowcasts and forecasts for headline and core PCE inflation are shown in the following chart, where the different lines describe the estimates for the different information sets. We find that the PCE release for September (12/05/25) had limited influence on the forecasts for October-December when compared to our October baseline. In contrast, the November CPI release (12/18/25) greatly reduces the PCE nowcasts and forecasts for October through December; that is, the November nowcast for headline inflation is nearly 50 percent lower (falling from 0.23 to 0.12) when compared to the benchmark. For core inflation, the drop is slightly lower but still sizable (from 0.23 to 0.13).
November and December Data Gave Opposing Messages About Inflation Dynamics
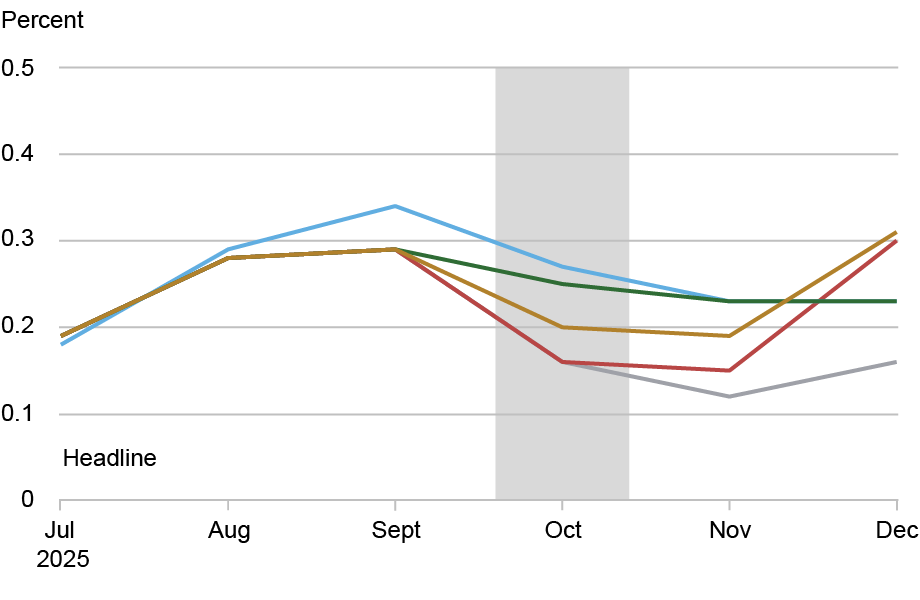
Notes: The chart plots PCE inflation nowcasts and forecasts for the information sets available on 10/24/25, 12/05/25, 12/18/25, 01/13/26, and 01/22/26 as indicated by the different colored lines. The vertical gray bar indicates that no CPI/PCE data were available for this period. The top panel provides estimates for headline PCE inflation and the bottom panel for core PCE inflation.
The December CPI release (01/13/26) changes the optimistic impression that the November CPI provides. Based on December data, the nowcast for November moved upward slightly, but most importantly, the December nowcast now exceeds the benchmark forecasts for December, thus erasing any reductions in inflation suggested by intermediate data releases. This holds both for headline and core PCE inflation.
Is It Trend?
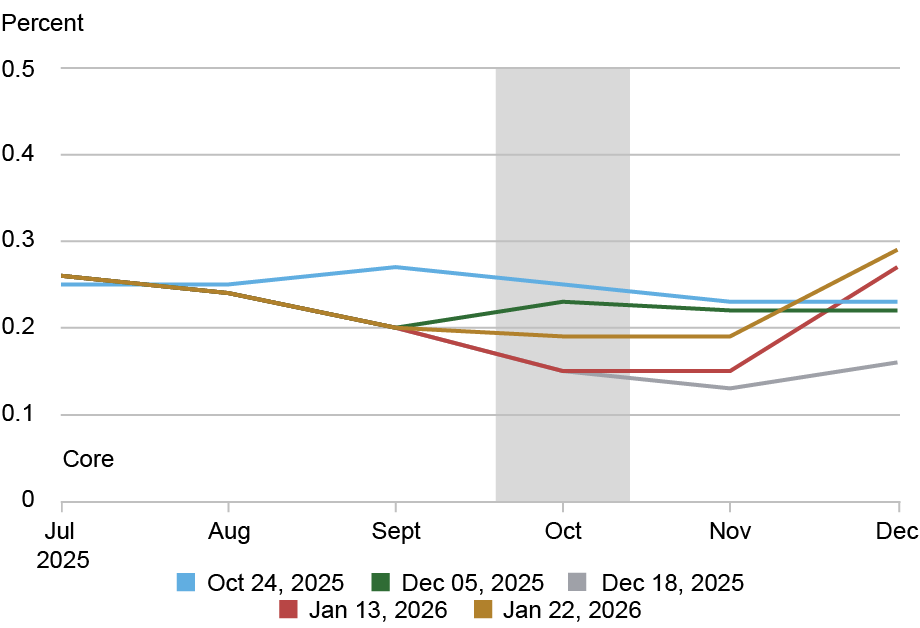
The nowcasts and forecasts that we discussed mix transitory and trend components. This leaves open the possibility that the documented differences stemming from the November and December CPI releases are merely transitory. For instance, measurement error introduced by data collection during or just after the government shutdown may explain the differences. To investigate this possibility, we extract the trend estimates from the MCT for the different data releases. The estimates are shown in the following chart. The top left panel shows the aggregate trends for each release.
November and December Data also Impacted Trend Estimates
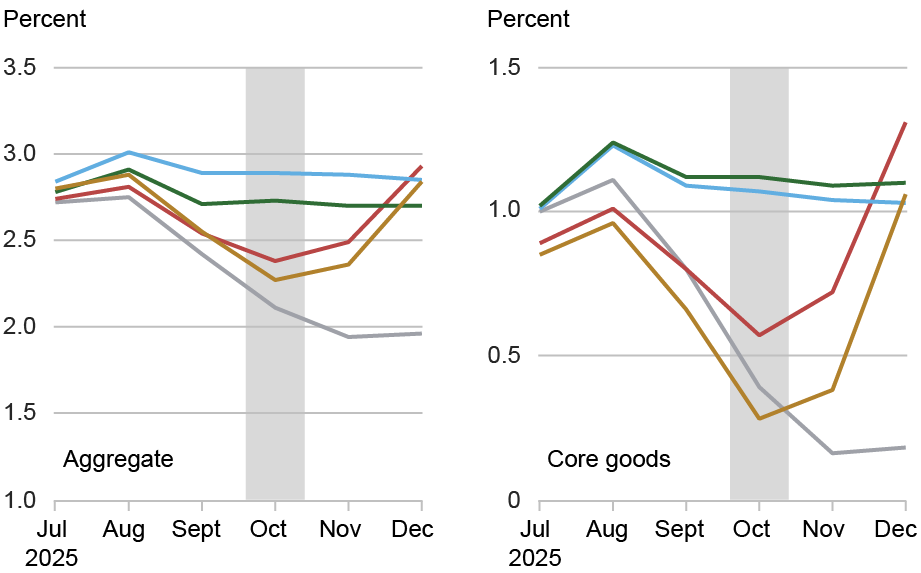
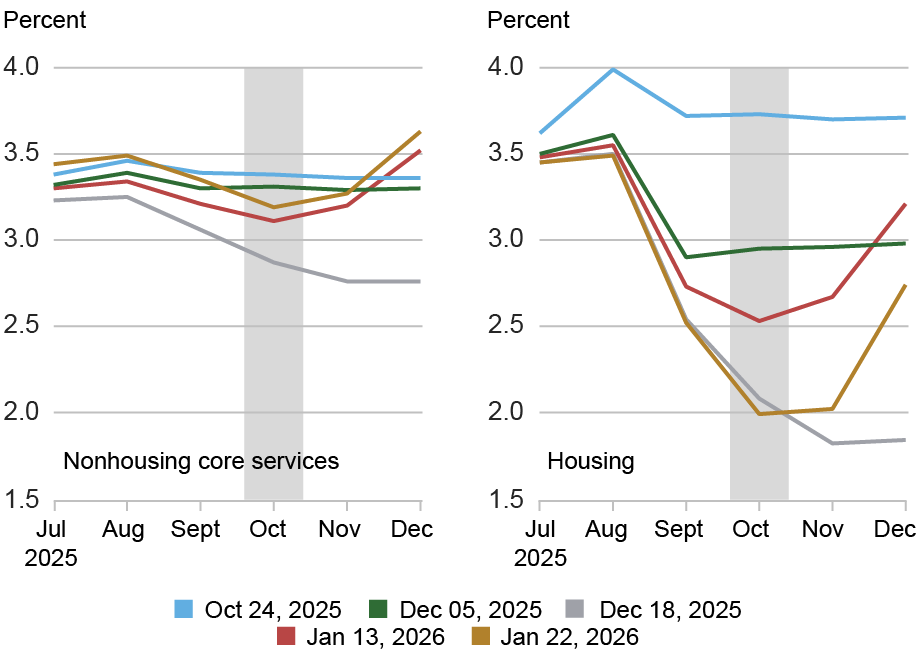
Notes: The panel chart plots trend inflation estimates for different information sets that were available on 10/24/25, 12/05/25, 12/18/25, 01/13/26, and 01/22/26 are indicated by the different colored lines. The vertical gray bar indicates that no CPI/PCE data were available for this period.
We find a similar pattern to that for the PCE nowcasts: the November CPI greatly reduced the trend estimate, whereas the December CPI returns the trend to its benchmark level established by the pre-shutdown information set dated 10/24/25. Not only is the aggregate trend estimate for December roughly unchanged from its October forecast, but it increased relative to the September estimate. Specifically, the December MCT stands at 2.83 percent whereas the September estimate was 2.55 percent.
Looking at the trend components for different broadly defined sectors—core goods, nonhousing core services, and housing—shows that the patterns observed for the aggregate are replicated across sectors. There are differences regarding the post December level, which is either above its September level (core goods and nonhousing services) or below (housing). But the conflicting effects of the November and December CPI releases are visible in each sector-specific trend.
We conclude that the changes documented in the PCE nowcasts and forecasts across the different CPI releases are not solely due to transitory components but are very much driven by changes in the trend components of the model.
Was November CPI Unusual?
Given the findings above, it is natural to ask whether the November CPI and PCE releases were unusual. Indeed, at the time of the CPI release, numerous economists and market analysts raised substantial concerns about the reliability of the release, noting that significant gaps in data collection—caused by the recent federal government shutdown—likely distorted the inflation figures. Many price observations typically gathered in October were missing, and delayed data collection in November meant that some prices were only captured later in the month, including during heavy holiday discounting, which can artificially lower reported inflation. This raised skepticism among experts who warned that the headline slowdown may not reflect true underlying price trends and could be an artifact of the disrupted methodology rather than a genuine shift in inflation dynamics.
To study the impact of the November CPI in more detail, we compare our latest nowcast, based on the information available on 01/22/26, with a nowcast that is computed after setting the November CPI and PCE to missing. The next chart shows the comparison for the PCE nowcasts. We find that PCE headline and core nowcasts omitting the November CPI release imply that headline and core PCE inflation were nearly constant, or slightly increasing over the September-November period.
November CPI/PCE Inflation Was Unusually Low
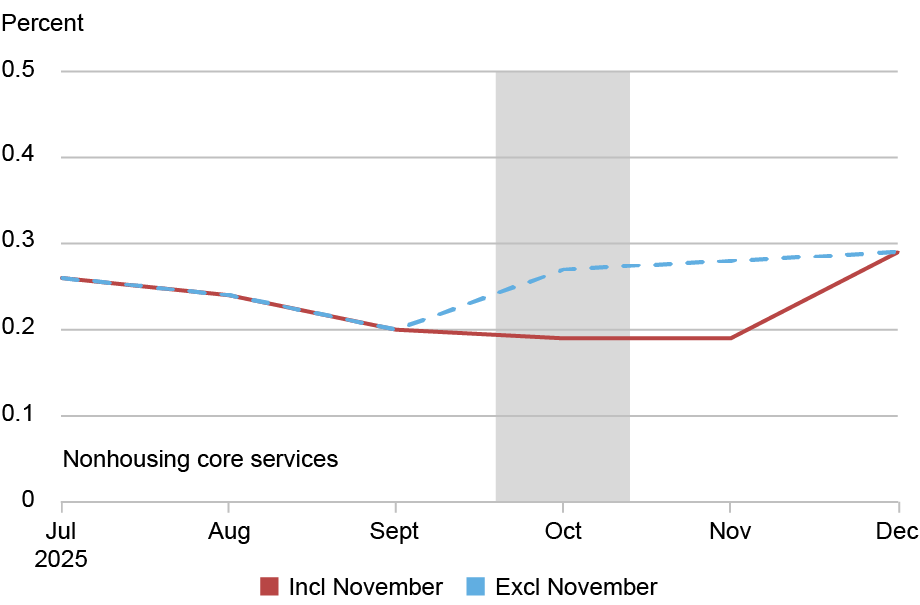
Notes: The chart plots monthly PCE inflation nowcasts and forecasts for the information set available on 01/22/26, either including (solid line) or excluding (dashed line) November CPI and PCE. The vertical gray bar indicates that no CPI/PCE data were available for this period.
The large downward revision in the trend estimates leads us to conclude that the November data were indeed unusual, likely reflecting the delays in data collection caused by the shutdown. But because these issues were temporary, we see the trend estimates from our MCT model that incorporate December data as a reliable signal of the current state of inflation. By that measure, inflation was close to 3 percent by the end of 2025.

Martín Almuzara is a research economist in the Federal Reserve Bank of New York’s Research and Statistics Group.

Geert Mesters is an economic research advisor in the Federal Reserve Bank of New York’s Research and Statistics Group.
How to cite this post:
Martin Almuzara and Geert Mesters, “Seeing Through the Shutdown’s Missing Inflation Data,” Federal Reserve Bank of New York Liberty Street Economics, February 17, 2026, https://doi.org/10.59576/lse.20260217
BibTeX: View |
Disclaimer
The views expressed in this post are those of the author(s) and do not necessarily reflect the position of the Federal Reserve Bank of New York or the Federal Reserve System. Any errors or omissions are the responsibility of the author(s).