
In the second quarter of 2022, the homeownership rate for white households was 75 percent, compared to 45 percent for Black households and 48 percent for Hispanic households. One reason for these differences, virtually unchanged in the last few decades, is uneven access to credit. Studies have documented that minorities are more likely to be denied credit, pay higher rates, be charged higher fees, and face longer turnaround times compared to similar non-minority borrowers. In this post, which is based on a related Staff Report, we show that banks vary substantially in their lending to minorities, and we document an overlooked factor in this difference—the inequality aversion of banks’ stakeholders.
Substantial Differences in Banks’ Lending to Minorities
We use mortgage applications data collected under the Home Mortgage Disclosure Act to calculate banks’ lending to minorities. Our data set consists of 114.3 million loan applications received by 838 banks from 1995 to 2019. For each bank and for each year, we calculate the bank approval ratio, defined as the number of mortgage applications approved divided by the number of mortgage applications received.
The difference in lending to minorities across banks is sizable. The chart below shows the distribution of banks’ “approval gaps”—defined as the difference in the approval ratios for mortgage applications made by minority and non-minority borrowers. Such approval gaps tend to be positive (so that approvals are lower for minority applicants) and heterogenous across banks. Crucially, this variation persists within a narrow geographical area (such as county or census tract), suggesting that banks with small approval gaps are not systematically located in areas of the country where minorities have a relatively low credit risk.
Banks’ Lending to Minorities Varies Substantially
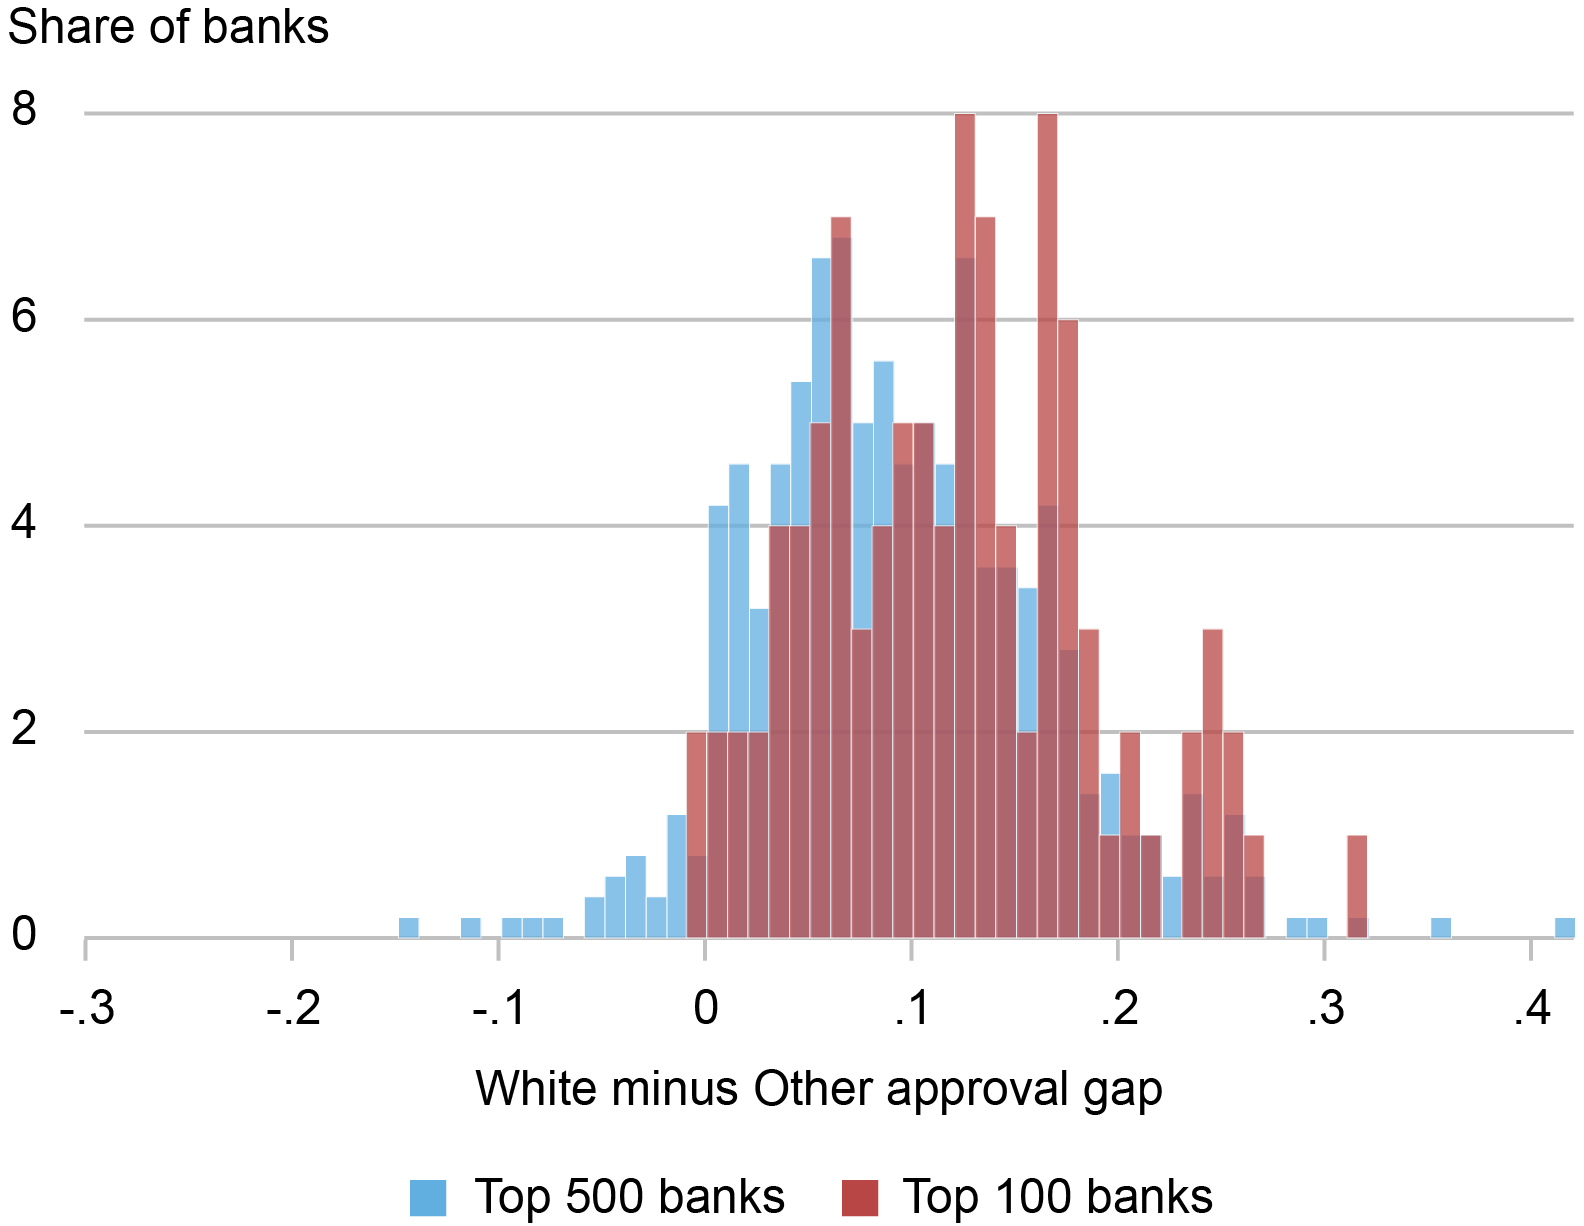
Source: Home Mortgage Disclosure Act (HMDA) data.
Notes: The chart shows the distribution of approval gaps, defined as the mortgage application approval ratio for white applicants (HMDA race code 5) minus the mortgage application approval ratio for other applicants (HMDA race codes 1-4). Top 500 and top 100 banks are defined based on the number of applications received. The sample period is 1995-2019.
An Overlooked Factor in Banks’ Lending to Minorities
Measuring stakeholders’ inequality aversion is challenging. It requires both a definition of stakeholders (which include, for example, depositors, borrowers, employees, and executives) and a measure of their preference for equal outcomes, resources, and opportunities. Given that bank stakeholders are mostly local, we calculate bank inequality aversion using a survey question on the desired level of government assistance to minority households from the General Social Survey (GSS), a nationally representative survey conducted since 1972 and widely used in academic studies.
Specifically, we use a survey question that asks whether “we’re spending too much money, too little money, or about the right amount of money on assistance to Black households.” Survey respondents can choose one of these three options, coded with the numbers 1, 2, and 3. We then calculate, for each bank, the weighted average of these responses, using the fraction of deposits that each bank has in the area where the respondent is located as weights.
It’s important to note that our analysis is not based on direct information about any bank’s depositors, board of directors, or management, or anything else specific about a bank other than the location of its branches. In the absence of information about banks’ actual stakeholders, we assume that the inequality aversion of the respondents who live in the area where a bank has a branch presence is representative of the preferences of its stakeholders.
With these caveats in mind, we find that banks with more inequality-averse stakeholders by our measure tend to have smaller approval gaps, as shown in the chart below. The data are analyzed within census tracts, thus ruling out that this negative correlation is entirely due to banks with more inequality-averse stakeholders operating in areas where minorities have a lower credit risk. Similarly, within census tracts, banks with more inequality-averse stakeholders do not systematically receive applications from higher-income minority borrowers, suggesting that minority borrowers with lower credit risk do not systematically apply for mortgages with more inequality-averse banks.
Inequality-Averse Banks Lend More to Minorities
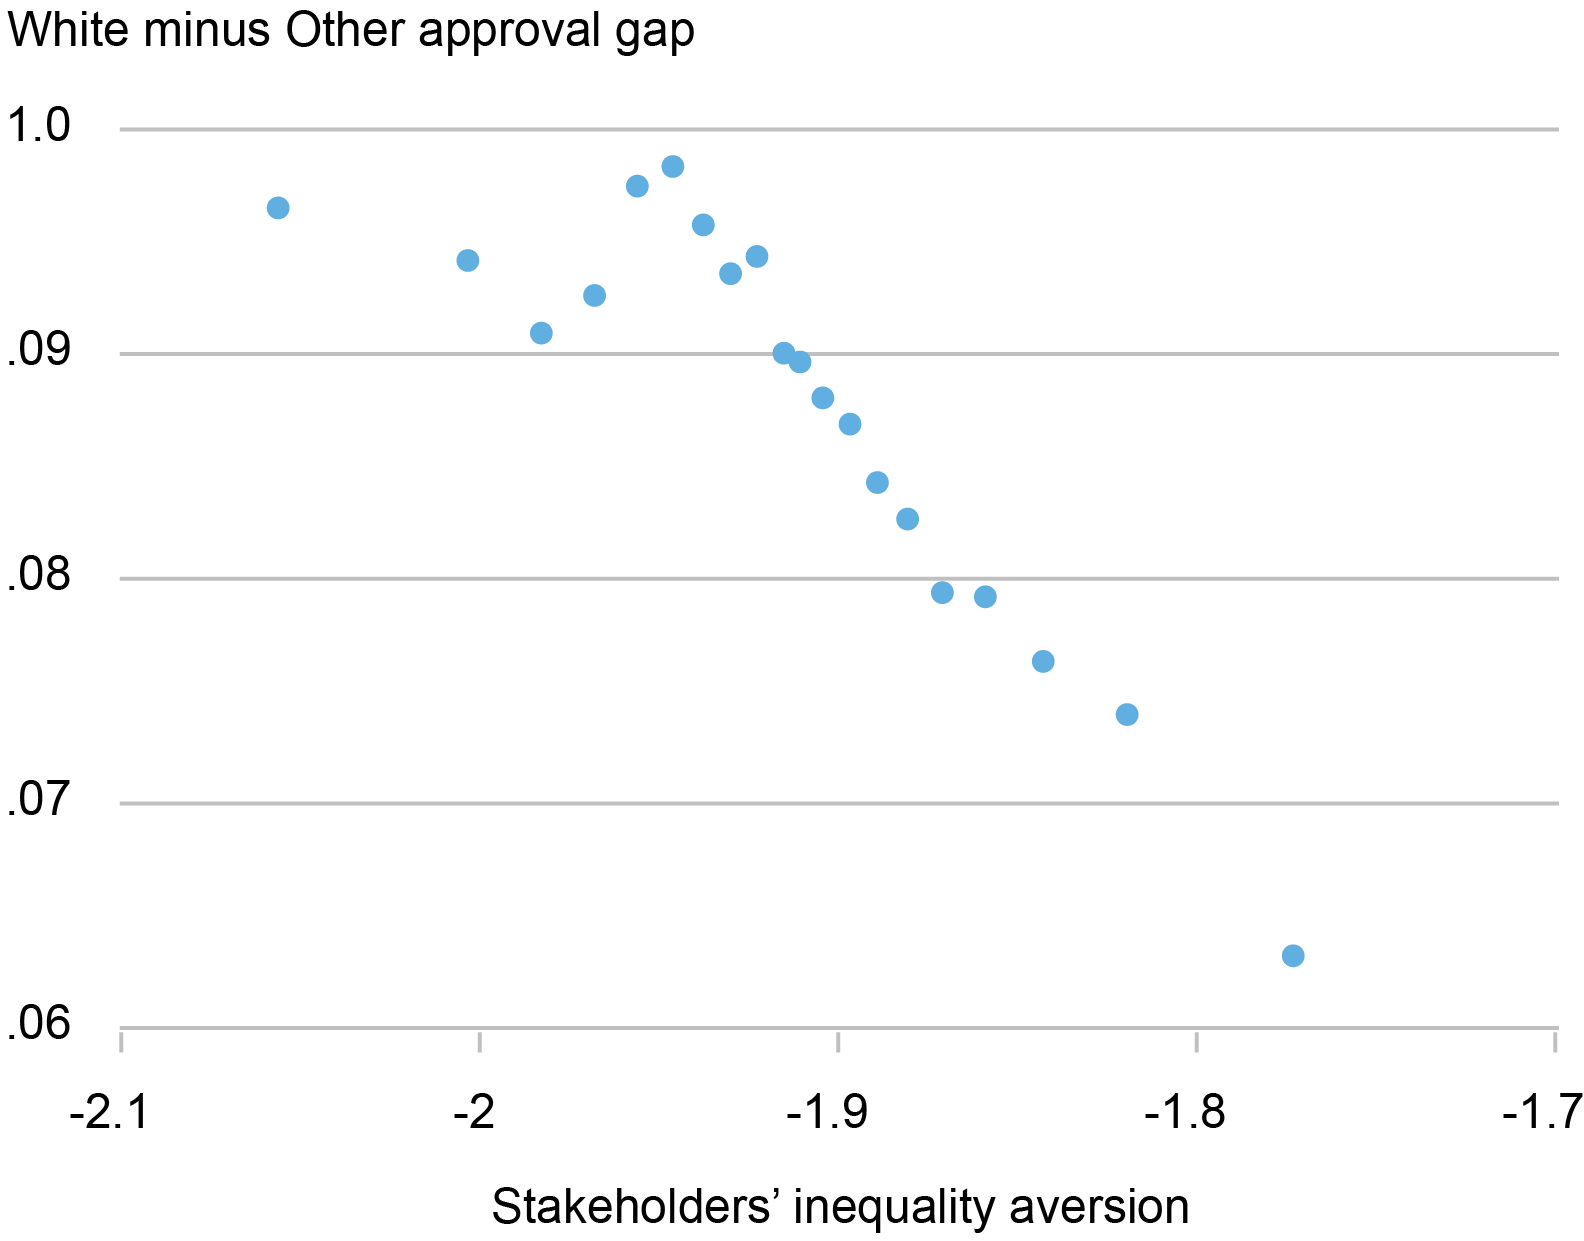
Sources: Home Mortgage Disclosure Act (HMDA) data; MIT Election Data and Science Lab; FDIC summary of deposits.
Notes: This binscatter plots banks’ non-minority minus minority approval gaps (the mortgage application approval ratio for white applicants (HMDA race code 5) minus the mortgage application approval ratio for other applicants (HMDA race codes 1-4)) on the y-axis against stakeholders’ inequality aversion (multiplied by minus one) on the x-axis. The analysis controls for census tract–year fixed effects. Banks are grouped in bins for readability.
How Might Stakeholders Affect Banks’ Lending?
So, how might an institution’s stakeholders impact its lending decisions? Likely indirectly. A possible channel is that, in their lending decisions, banks consider the inequality aversion of the counties in which they operate so as to attract and retain their (mostly local) stakeholders. Consistent with this mechanism, we find that banks that have been hit with a Department of Justice (DOJ) case for discrimination in mortgage lending experience a sizable drop in deposits, one that is particularly pronounced in counties with high inequality aversion. This result, detailed in our Staff Report, is consistent with recent anecdotal evidence on how stakeholders’ social considerations affect financial institutions.
Importantly, the higher lending to minorities of banks with inequality-averse stakeholders has a small and positive effect on performance, suggesting that it is not a manifestation of costly “goodness.” Specifically, the narrowing in approval gaps between minority and non-minority borrowers is followed by a small improvement in banks’ mortgage book quality and a small increase in overall bank profitability.
Final Thoughts
Our insight on the interaction between stakeholders’ inequality-aversion and banks’ lending to minorities is related to the discussions about lending discrimination and racial and ethnic disparities in housing. On the one hand, such inequality aversion might alleviate lending discrimination based on race and neighborhood characteristics. On the other hand, it might drive banks to specialize in different segments of the residential mortgage market. One interesting avenue of future research is understanding to what extent credit access for minorities might differ across the country based on the inequality aversion of local stakeholders.

Matteo Crosignani is a financial research advisor in Non-Bank Financial Institution Studies in the Federal Reserve Bank of New York’s Research and Statistics Group.
Hanh Le is an assistant professor of finance at the University of Illinois Chicago.
How to cite this post:
Matteo Crosignani and Hanh Le, “An Overlooked Factor in Banks’ Lending to Minorities,” Federal Reserve Bank of New York Liberty Street Economics, January 10, 2024, https://libertystreeteconomics.newyorkfed.org/2024/01/an-overlooked-factor-in-banks-lending-to-minorities/.
Disclaimer
The views expressed in this post are those of the author(s) and do not necessarily reflect the position of the Federal Reserve Bank of New York or the Federal Reserve System. Any errors or omissions are the responsibility of the author(s).