
The labor share of income in the U.S. is currently at its lowest-ever level in the post-war period. The labor share measures the fraction of economic output paid to workers as wages and salaries. As such, it is a useful benchmark for wage growth: when the labor share falls, it means that productivity, prices, or both are growing faster than wages. After much-studied drops in the 2000s, the labor share fell sharply again after the COVID pandemic. In this post, we compare the dynamics of the labor share post-COVID to earlier periods to understand whether the recent decline represents the continuation of a trend or a new and distinct phenomenon. We find that both the cyclicality of the labor share and the contribution of reallocation to the labor share post-COVID are similar to earlier periods.
The Evolution of the Labor Share
To contextualize the post-COVID decline in the labor share, we first describe its long-run evolution, illustrated in the chart below. For much of the post-war period, the labor share was remarkably stable, hovering around 63 percent through the late 20th century. Starting in the early 2000s, however, it entered a sustained decline, with a particularly sharp drop during the global financial crisis (GFC). The labor share is a core object of interest in the academic and public debate—it measures the share of aggregate income going to workers as opposed to capital—and a large academic literature discusses the long-run forces behind this downward trend, including technological change, the rise of “superstar” firms, and increasing markups.
The Labor Share Has Declined Since the 2000s
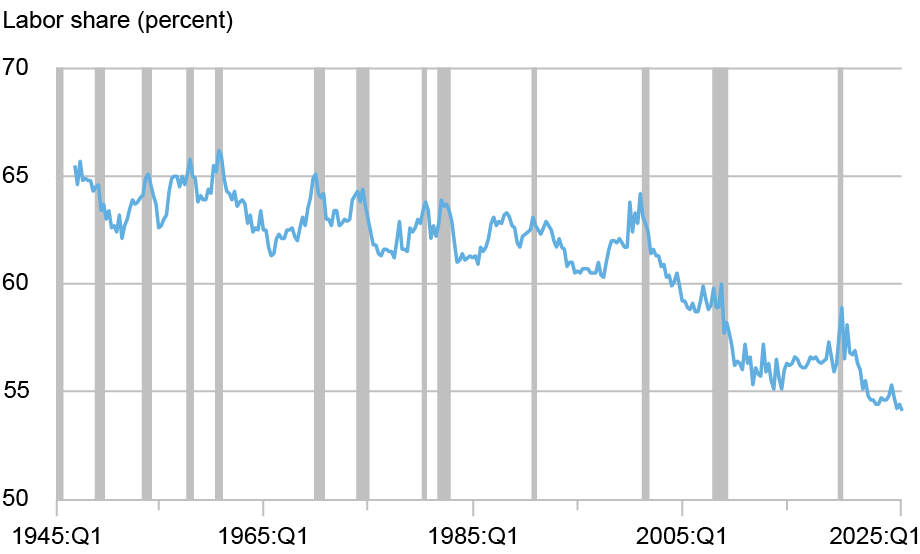
Note: Shaded regions indicate U.S. recessions.
In this post, we zoom in on the post-COVID decline in the labor share. After stabilizing in the 2010s, the labor share declined again during the post-COVID period, ultimately falling 1.6 percentage points below its pre-pandemic level. The labor share now stands at an all-time low in the post-war period. Given that the labor share declined in the two most recent recessions, how does the post-COVID decline compare to earlier recessionary episodes?
Is the Post-COVID Decline Typical Across U.S. Recessions?
In the next chart, we study the path of the labor share around various recession–expansion periods, tracing its trajectory from the onset of a downturn. We then assess whether the post-COVID decline mimics the dynamics of the labor share across earlier cycles.
The Post-COVID Evolution of the Labor Share Aligns with
Pre-2000 Recessions
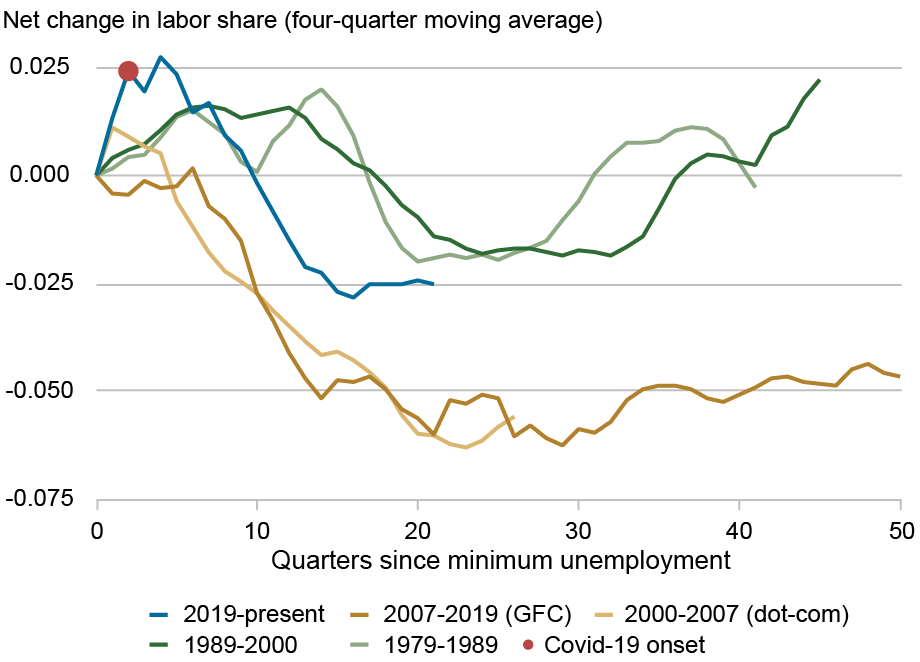
Most pre-2000 periods follow a similar pattern: the labor share increases during a recession, declines through recovery, and then rises again later in the expansion. While we restrict attention to the two most recent pre-2000 recession–expansion periods (1979-1989 and 1989-2000) and omit earlier episodes for clarity, we find broadly similar dynamics across these cycles.
This behavior changes in the 2000s. Following both the dotcom recession and the GFC, the decline in the labor share during expansion is steeper than in earlier cycles. Moreover, unlike in pre-2000 episodes, the labor share does not meaningfully rebound later in the expansion.
The dynamics of the labor share at the onset of the COVID pandemic actually appear more similar to pre-2000 recessions: the labor share increases sharply followed by a modest decline before flattening out. Judging by past recessions, we would need a longer expansion to see the labor share rise again.
Another source of difference across recession–expansion episodes is the degree of reallocation in economic activity. As businesses and households adjusted to pandemic restrictions, economic activity may have shifted substantially across sectors. This raises the question of whether these shifts contributed to the recent decline in the aggregate labor share.
Did Sectoral Reallocation Drive the Post-COVID Decline in the Labor Share?
Some industries have higher labor shares because they rely more heavily on human labor and skills. For instance, healthcare and education tend to have higher labor shares because output relies primarily on workers’ time and expertise, while manufacturing and agriculture have lower labor shares because machinery and automation play a larger role in output. If, in the post-COVID years, a larger share of output came from low labor share industries, the aggregate labor share could decline even if labor shares within industries remained constant.
To see if COVID stands out in terms of reallocation compared to earlier recessions, we construct a reallocation index, defined as the aggregate of absolute changes in sectoral output shares across periods. The chart below plots this index across the three most recent recession episodes: 1999-2004, 2007-2012, and 2019-2024. We find that although sectoral reallocation spiked at the onset of the COVID pandemic, it then moderated and stabilized at a lower level. In contrast, earlier recessions exhibited more persistent and increasing reallocation.
COVID Led To a Spike in Economic Reallocation That Quickly Subsided
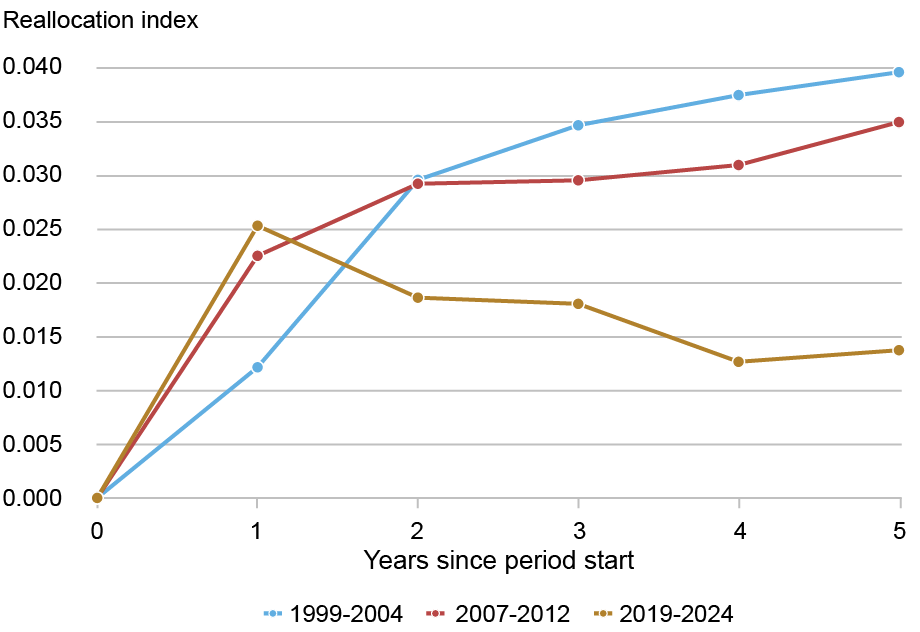
Notes: The chart shows the sectoral reallocation index, which measures how much output has shifted across fourteen major sectors. For each year, the index measures the total change in sectoral shares of value added relative to the base year for that period. Higher values indicate that a larger fraction of economic activity has been redistributed across sectors, while lower values imply that changes in aggregate output primarily reflect a relatively uniform change across industries. An index value of zero means that sectoral shares are identical to the reference year.
However, the overall amount of reallocation does not by itself determine the effect on the aggregate labor share. Even modest shifts in economic activity could reduce the aggregate labor share if they move output toward industries with lower labor intensities. To evaluate this channel, we implement a standard “shift-share” decomposition of the payroll share, which measures labor income excluding nonwage compensation. We decompose the change in the aggregate payroll share into two parts: changes happening within industries (“shift”) and changes due to economic activity moving between industries (“share,” or reallocation). The chart below presents this decomposition for the same recession episodes as before.
The red bars show the total change in the aggregate payroll share between the first and last year of each period. The gold bars capture how much of that change in the payroll share was caused by shifts within industries—for instance, changes in how much retail pays workers relative to its own output. The blue bars show how much of the change is due to economic activity moving between industries—for instance, whether output shifted toward sectors that generally have higher or lower payroll shares.
Within-Industry Declines, Not Between-Industry Reallocation, Drove the Fall in the Aggregate Payroll Share
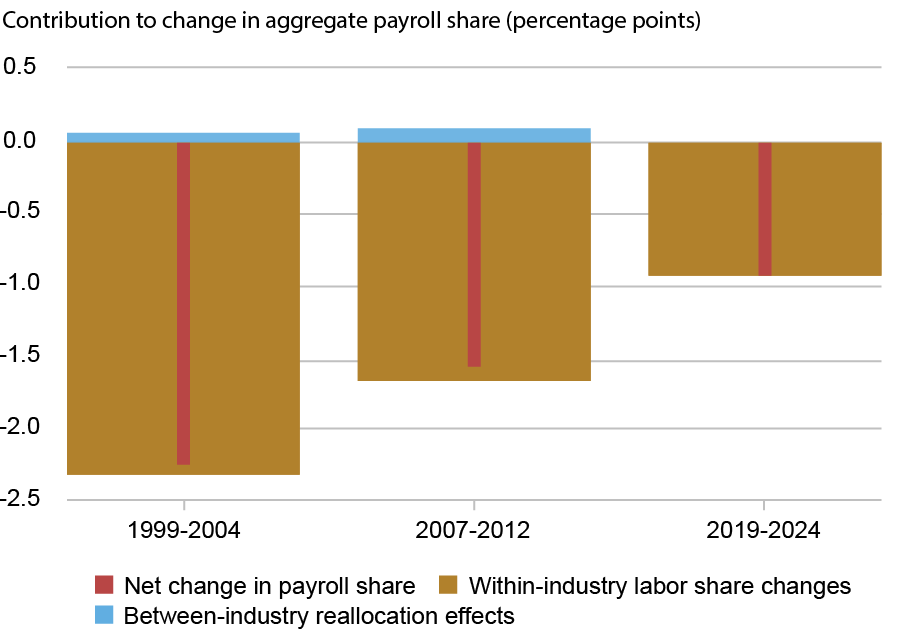
Notes: For each period, the change in the aggregate payroll share is decomposed into (1) a shift component, reflecting changes in within-sector payroll shares, and (2) a share component, reflecting changes in sectoral composition. The shift and share component sum to the change in the payroll share across the period.
From this shift–share decomposition, we find that declines in the aggregate payroll share during COVID, and the previous two recessions, were entirely driven by changes within industries rather than shifts across industries. Across all three recession periods, we find that movements in output across sectors contribute nothing or very little to the change in the aggregate payroll share.
Conclusion
This post documents a persistent drop in the labor share following the COVID pandemic. Is this decline a distinct change from the recent behavior of the labor share in the U.S.? Along the two key dimensions we investigate, our answer is no. First, the labor share’s trajectory post-COVID broadly follows the cyclical patterns observed in earlier recessions, with a decline during the recovery phase that mirrors historical dynamics. Second, the decline in the labor share since COVID is driven primarily by within-industry changes rather than shifts in economic activity across sectors. Taken together, these results suggest that the post-COVID decline follows the same cyclical patterns as earlier recessions and is driven by the same within-industry forces, and they provide little evidence that it will evolve differently from past episodes.

Richard Audoly is a research economist in the Federal Reserve Bank of New York’s Research and Statistics Group.

Miles Guerin is a research analyst in the Federal Reserve Bank of New York’s Research and Statistics Group.

Srinidhi Narayanan is a research analyst in the Federal Reserve Bank of New York’s Research and Statistics Group.

Rachel Schuh is a research economist in the Federal Reserve Bank of New York’s Research and Statistics Group.
How to cite this post:
Richard Audoly, Miles Guerin, Srinidhi Narayanan, and Rachel Schuh, “The Post‑COVID Decline in the Labor Share,” Federal Reserve Bank of New York Liberty Street Economics, June 24, 2026, https://doi.org/10.59576/lse.20260624
BibTeX: View |
Disclaimer
The views expressed in this post are those of the author(s) and do not necessarily reflect the position of the Federal Reserve Bank of New York or the Federal Reserve System. Any errors or omissions are the responsibility of the author(s).